Notes from the 2014 Salish Sea Ecosystem Conference (liveblog)
Thursday, 5/1/2014
8:30
Parker MacCready (with Matthew Alford)
Observations of flow and mixing in Juan de Fuca Canyon
Pacific water on the continental shelf exerts strong control over Salish Sea productivity, hyposia, and acidification. It is the most important source of nutrients for Puget Sound by a couple orders of magnitude.
The problem is that the Pacific water properties vary strongly with depth. There’s high oxygen water near the surface (DO as high as 110 near 150m) and low oxygen water below (DO ~50 at 800m).
The water enters the Strait of Juan de Fuca via the Juan de Fuca canyon, an understudied region
(see Glenn Cannon, 1972) that cuts across the continental shelf. It’s deep enough relative to the shelf that the inflow can move up the canyon (moving east-northeastward at about 40 cm/s, independent of the tidal state) underneath the surface current on the shelf (typically southeastward flow).
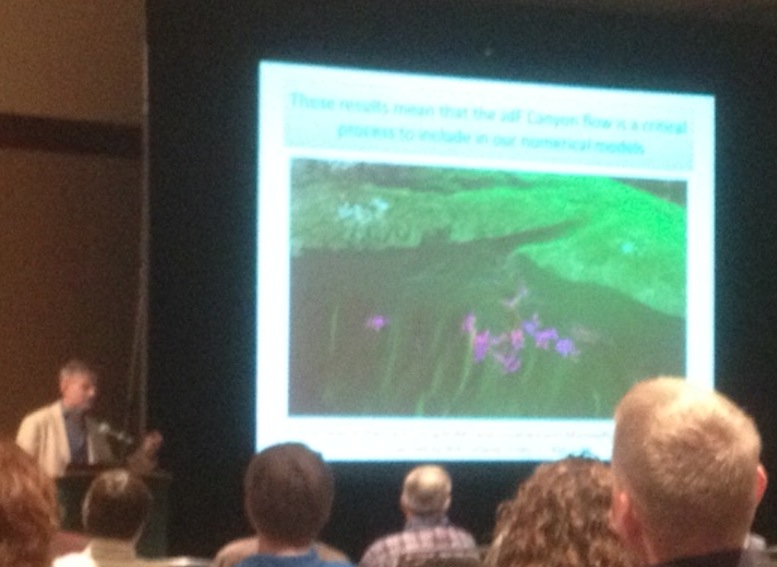
The along-canyon flow gets up to 75 cm/s. As it moves over sills, internal lee waves form that have amplitudes of up to 80m.
ROM model runs show inflow across shelf is primarily via the canyon:
Richard Feely
The impacts of upwelling ocean acidification and respiration on aragonite saturation along the WA continental margin
Due to upwelling we are seeing pH conditions that won’t be seen the global surface ocean until the end of this century. The upwelling low O2 water also has high pCO2, low aragonite saturation state, low pH for water >80m depth.
Feely described a new model that can predict water properties 6 months in advance, a tool which could be very valuable to Salish Sea shelfish growers.
Local respiration uses up the (already low) oxygen and increase pH as the water flows in. This can result in anoxic events downstream.
What forces the inflow? Wind from the north!
Ref: Alford and MacCready (2014) Flow and mixing in Juan de Fuca Canyon, Washington. Geophysical Research Letters, 41.
Rob Fatland is talking later about using ROM to visualize the flow of water across the shelf, primarily via the canyon.
The transport observed is about equivalent to the Amazon River, 200,000 m^3/s, easily enough for the Salish Sea “estuarine circulation” about 30,000 m^3/s.
9:00
Christie McMillin (Marine Education and Research Society mersociety.org)
Anthropogenic threats to humpback whales in the Salish Sea: insights from northeastern Vancouver Island
2012 Juvenile humpback stranded (long line entanglement)
2013 photographs (by Mark) indicate that it was a high recent year (along with 2011; nice graph)
1985 Merilees documented two periods of whaling in the Strait of Georgia in the late 1800s. Place names like Blubber Bay reflect this history.
Northeast Vancouver Island had whaling as late as 1968 and many humpbacks were taken in the 1950s on the west side of Vancouver Island.
Since 2006 they have documented 8 vessel strike injuries. Since 2009 there have been 5 witnessed cases of entanglement in prawn gear (3), crab gear (1), and seine net (1). In 4 of 5 entanglements, the whale was disentangled.
We can estimate total (non- + witnessed) entanglements by photographing leading edge of tail stock. This method suggests that 9 additional entanglements have occurred in our study area.
There are concentrations of humpback distributions northeast of Hanson Island, while much lower densities occur in Johnstone Strait (particularly SE of Hanson). This observation informed new signs warning vessel operators of the high density areas.
Is you witness entanglement or ship strike, DFO has a hotline, but with a VHF you can call the Coast Guard.
9:15
Jared Towers (DFO/Marine Education and Research Society)
New insights into seasonal foraging ranges and migrations of minke whales from the Salish Sea and coastal British Columbia
Minkes do breach!
Highest distributions are on west side of San Juan Island, the banks, and Race Rocks, as well as North Vancouver Island. Lower densities further north and on the outer west coast of Vancouver Island. Despite effort, none were observed off Nanaimo area in the Strait of Georgia.
Strong seasonal distribution, peaking in July. No sighting during ~Oct-Mar.
Previous research: Dorsey et al., 1990. Rep Int. Whal. Commn. Special Issue 12.
Intra-annual movements occur spring-to-summer and summer-to-fall suggest migration. Ecological markers (e.g. scars, swordfish beaks embedded in blubber, diatom coatings or barnacles, cookie cutter shark bites, lamprey scars, Xenobalanus colonizing trailing edge of fins [occurs in tropical east Pacific]). Ref: Towers et al. (in press) Cetacean Research & Management (?)
Prey seems to be juvenile herring and juvenile and adult sand lance. We observe bait balls in the NVI and they may occur in the SJI area, too.
9:30
Marla Holt (recording in .mp3 format)
Using acoustic recording tags to investigate anthropogenic sound exposure and effects on behavior in endangered killer whales
Goals: quantify noise that individual SRKWs experience; determine relationship between vessels and their attibutes and received noise levels (RL); investigate kw acoustic and movement behavior during foraging.
Digital Acoustic Recording Tags (DTAGs) have two hydrophones (one for background noises, one for KW signals), as well as orientation and movement sensors. We have 3 field seasons of data so far (Sep 2010 [before 2011 vessel distance increase from 100-200 yards], Jun 2011, Sep 2012) and plan more deployments this year. 23 tags on all three pods.
Animation of a 7-hour tag in Haro Strait SE down Haro canyon, across to Salmon bank, south along its western edge, and then across to ENE Hein bank.
Received levels: RMS averaged over 1 sec in dB re 1 uPa, 1-40kHz band. 2768 measurements of RL (w/o flow noise or whale signals), min 88 dB (3 vessels 2 stationary 1 slow (0-2) kts; Max 141 dB large fast vessel (ferry passing less than 300m from whale!) Julian Houghton’s theses working up predicted noise levels and finding speed and (size, distance??) are most important factors in RL.
Variations in pitch and roll may indicate foraging changes, but few prey samples have been acquired during focal follows with DTAG deployments.
9:45
M. Palomares
The Salish Sea ecosystem in FishBase and SeaLifeBase
We have documented the iodiverstiy of Salish Sea in two databases:
- fishbase.ca
- sealifebase.ca
~82 references used to assign 2,280 species to for ecosystems
Gatydos et al. 2008, 2011; Cowles 2005
Fish completed; birds and marine mammals need work; many invertebrates.
The full fish list is at — http://www.fishbase.ca/trophiceco/FishEcoList.php?ve_code=1067
These data (particularly the trophic pyramid, as well as the “1-click ecosystem routine’) should help researches build ecosystem models. 68% of fish species have biological data in FishBase. There are at least 12 species that are commercially important that don’t have life history data, so they could not be included in the reslience estimations.
There are efforts to cross-reference with the barcode of life movement.
10:45
I. Vilchis
Common risks among declining marine predators suggest ecosystem change
39 taxa of wintering birds in 8 Salish regions and three depth categories
The birds most likely to undergo a decline (based on their model) were the diving birds without local breeding colonies. Across categories, decline probabilities are higher in the birds that eat fish (vs non-fish eaters).
Why are diving birds over-wintering less in the Salish Sea? We suspect that this is because there have been long-term decreases in the forage fish abundance in the Salish Sea. (Some studies have shown concomitant increases in over-wintering populations in California.)
One idea is that the specific power required to maintain a certain air speed is much higher for diving birds. (Nice use of archive.org videos embedded in slide to show difference in flapping frequency in puffins vs frigates.)
Conclusion: Salish Sea birds are shifting wintering feeding ground as a result of lack of prey.
11:00
P. Arcese
A century of change in trophic feeding level in diet specialist marine birds of the Salish Sea
Western Grebes have declined by 97% in 40 years here and increased 230% in southern CA. Pacific sardines were extremely abundant before being overfished, but the have come back dramatically since the 1980s (Ref Hill, 2010?)
Murrelets in BC have gone from ~500k to 50k population and were studied isotopically using historic samples (feathers formed early in year [condition prior to breeding]) from museums around the world, including bird collected by Vancouver (Norris et al. 2007, Journal of Applied Ecology). The dN15 decline they observe suggests a decrease in trophic level of the murrelet diet from mainly fish to mainly euphausids. Fecundity vs bird count data, suggest that forage fish abundance may be limiting reproductive rates.
Even glaucus winged gulls are in decline. Mondarte populations down from ~3000 to ~900. Average age size is also decreasing (Blight, 2011).  The isotopic decline in gull feathers is consistent with the murrelets.
The western grebe is a herring specialist, but isotopic data from grebes have maintained diet (on herring) but most have left the Salish Sea.
11:15
Jessica Lundin
Persistent organic pollutants (POPs) in the Puget Sound ecosystem: An evaluation of POPs in fecal samples of Southern Resident killer whales
247 samples in final analysis, including toxicants, hormones, and genotyping
Toxicant results: dried fecal samples vs blubber samples from same whale (30 whales) show strong corrleation; unprocessed (undried) fecal samples vs blubber also highly correlated.
- Higher ratios of ppDDE/sum(4PCB) are highest in L, and secondarily K pods relative to J pod
- Females with >1 calf have lower 2-5x toxicant loads than juveniles, males, and post-reproductive females (who have the highest values)
Graphs of Columbia and Fraser Chinook returns show a ~2 month gap during which there is evidence that toxicant are being mobilized from their lipid stocks.
Ratio of sum(PBDE)/ppDDE shows an increasing trend (2010-2013) suggesting that PBDEs are bioaccumulating.
Next steps are to look at relationships between toxicants and hormone. A pregnancy test has been developed which could be used to assess reproductive success (and hypothetically may be influenced by toxicants).
11:30
30 minute discussion (.mp3 format) at end of Session on “Marine birds and mammals of the Salish Sea: identifying patterns and causes of change – II”
Lunchtime presentations:
- Sustainability Ambassadors
- Martha Kongsgaard, The Moibus strip of science and policy in ecosystem recovery (.mp3 format) [note: Comparing the RMS background noise levels before and after Martha sang to the over-chatty crowd of ~500, there was a 6 dB drop!]
 Friday May 2, 2014
9:30
Natalie Hamel
The 2013 State of the Sound Status of the ecosystem
PSEMP = Puget Sound Environmental Monitoring Program works with partners to monitor and report conditions and assess restoration efforts. The Puget Sound Vital signs are one tool used to assess ecosystem conditions. Such assessments go back many years (e.g. “Puget Sound’s Health” 1998) and should be continued.
Vital Sign characteristics:
- The “wheel” is fundamentally a communication device, designed for a wide audience (simple, distilled, appealing)
- Indicators founded in science, prioritizing: good surrogates for ecosystem conditions; available historic data; quick response to ecosystem change (including restoration efforts)
- Connections to recovery goals (with both baselines and targets)
Graphs and interpretation of trends in them are simplified into a simple progress scale (with baseline at center, target delineated, and % change indicated by a marker of current conditions.
As of the end of 2013, a few vital signs showed progress, some have lost ground (e.g. orcas), and many that are far from the 2020 targets. One concern is a need for more short-term, responsive indicators.
9:45
Kathryn Boyd
2013 State of the Sound: Accountability and funding of Puget Sound recovery
As of Sep 2013, 68% of the 2012 near term actions were on plan or complete, 12% were off-plan, 7% had serious constraints, and 12% were not started.  The primary cause of delays was lack of funding. In both 2012 and 2013 there were funding gaps of 100’s of millions of dollars.
The Action Agenda Report Card gets updated quarterly and automatically as partners report in. These online data show that the number of complete Near Term Actions (NTAs) is rising overall (2012Q3-2014Q1). Shellfish actions are a good example of steady progress to completion.
10:30
Brian Sackman
Eyes Over Puget Sound: Producing validated satellite products to support rapid water quality
RDI workhorse (300 kHz ADCP) on WA State ferries
Victoria Clipper samples every 5 secs (~100m), 80 mile transect 4 x /day, (T,S,Chl)
MERIS ocean color satellite (2000-2012) combined with others, e.g. LandSat (2000-present, 30-500m resolution nearshore; >1km coastal/offshore)
To ground-truth, they used partial least squares regression (commonly used in chemometrics, bioinformatics when many parameters are available and correlated). Working towards an operational workflow.
10:47
Amy Merten
Open source mapping to improve data sharing: Environmental response management application
Web-based mapping tool — Environmental response management application (ERMA) — aiming to make data sharing between agencies, coordinated through UW Tacomea’s Puget Sound Institute. Now trying to complete after starting before Deep Water Horizon spill distracted. Real-time data (e.g. from AIS, NOAA weather buoys, NANOOS), forecast data (weather?), and base maps and database (e.g. Marine Protected Area portal, Burke Herpetology collection, Encyclopedia of Puget Sound, NatureServe?, Audubon data on Canadian watersheds and bird distributions) goes to ERMA Data Center and is accessible from oil spill response Command Center.
Whale telemetry data can be imported and animated. Satellite tag example.
Upcoming events: August 2014 drill; CANUSPAC.
11:03
Rob Fatland (Microsoft Research)
Ebb and Flow: What we learn from visible circulation patterns in the Salish
All technological problems are solvable. You just need to find the write person.
Geophysicist (glacialogist turned oceanographer). Microsoft offering 1 free year Azure cloud computing, but the challenge is finding the right collaborators to help manage data. Cyberinfracture involves registering and communicating about data sets. Machine learning is the likely way to distill big data from the growing cyberinfrastructure.
Worldwide telescope is the core of http://layerscape.org
12:30
Wade Davis, UBC
The critical importance of preserving ecosystems for current and future generations & the significance of ancient wisdom
Audio recording ( .mp3 |.ogg | .flac )
1:30
McKechnie, I.
The Herring School: Long-term perspectives on herring in the Salish Sea and beyond
At 179 sites along BC coast and in WA (inland) herring was the major commonality (all but 2 sites on N Coast) and was extremely prevalent in the Salish Sea. % of herring relative to other fish (based on bone archealogy) varied from 80% in northern Strait of Georgia to 20% in Puget Sound. Distance from herring bone sites to existing herring spawning sites is <~2km.
Visible foodstuffs in a drawing of part of Chief Maquinna’s house include 2675 herring/anchovy, 20 flatfish, 10 greenling/cod/hake!
pacificherring.org was launched this morning. A really cool feature of it is the 12,000 year timeline of herring on the coast of Alaska, British Columbia and Washington.
2:15
T. Francis
Can we have our herring and eat our salmon too? A qualitative approach to modeling trade-offs in the Puget Sound foodweb
Foodweb figure coming…
2:30
J(oan?) Drinkwin (Northwest Straits Derelict Fishing Gear — winner of the 2014 Salish Sea Science Prize! http://www.derelictgear.org/ )
Observed impacts of derelict fishing nets on rocky reef habitats and associated species in Puget Sound
PS has lots of derelict fishing nets because of abundant rocky outcrops and long-history of salmon fishing. Nets located with side-scan sonar and reports from divers, etc. All material removed by hand, not grapnel. 4467 gillnets removed (95% of those located), 168 purse seine (10?%). 672 acres of habitat restored as of March 31, 2014. %5 of fish found dead in nets are rockfish (including one canary rockfish).
Next steps are to continue removal, including with expanded fleet.  Need funding to go deeper than 105′.
Annual net loss is 10-30 nets and our new program aims to keep new nets from accumulating in the environment, including education and tools to increase (often mandatory) reporting by fishers. Of 24 reports in pilot program, 10 were removed, 7 had unknown location, 2 not found, 4 not derelict fishing gear, 1 in Columbia River.
Read More


 Twitter
 LinkedIn
 Facebook