Orca and salmon recovery workshop (live blog)
Sponsored by the Puget Sound Partnership and organized by Orca Network, the Salish Sea Association of Marine Naturalists, and The Whale Museum, this workshop preceded the 2014 Salish Sea Ecosystem Conference.
Daniel Schindler, UW
The “Effects of salmon fisheries on SRKW” report
12:09 Starts with introduction of the science panel members
12:12 We were charged with evaluating the BiOp’s “chain of logic linking Chinook salmon fisheries to population dynamics of SRKW”
Population decline in both NRKW and SRKW was coordinated in late 1990s.
We were blown away by the quality of SRKW demographic data. This is probably one of the best-studied wildlife populations in the world.
Eric Ward estimated growth rate (lambda) as 0.99-1.04 (mean ~1.017, or ~1.7% exponential growth) for J/K pods and 0.985-1.035 (mean ~1.01, or ~1% exponential growth). The overall SRKW rate of 0.71% per year might increase to ~1%), but fisheries management changes are unlikely to raise the growth rate to the recovery goal.
There are 1000s of papers about Chinook salmon, but less is know about Chinook topics relevant to SRKWs. Listed 3 shortcomings.
Kope and Parken summarized Chinook trends for specific stocks important to SRKW. Coastwide there has been a modest decrease in recent pre-harvest Chinook abundance. There isn’t much room to lower commercial fishing in a meaningful way (e.g. decrease harvest of 20%).
Correlations between SRKW vital rates and Chinook abundance depends on abundance measure chosen. Mortality of SRKW should scale non-linearly with salmon abundance, but the existing correlations are linear.
12:38 Questions
Bain: Why weren’t acoustics impacts of fishing vessels considered? A: I don’t know. Perhaps because available data did not include fishing boats.
Felleman: Were analyses done using only Columbia Chinook? A: No, but you should email Eric Ward about that. You should also be careful about interpreting correlations as causal relationships. If you look for correlations from 50 different salmon populations, you’ll find strong ones just through random chance.
12:50
Elizabeth Babcock, NOAA
The intersection of salmon and orca recovery
Focus is on Puget Sound stocks. Locally-developed recovery plans for Puget Sound Evolutionary Significant Unit (14 watersheds from Neah Bay to Point Roberts; 22 populations) reviewed in 2005, then adopted plan in 2007, and are now implementing with partners.
70% of our estuary habitat area in Puget Sound have been lost…
13:00
Lynne Barre, NOAA
13:10
Mike Ford, NOAA
Salmon recovery and SRKW status
Noren (2011) suggest SRKW metabolic demand is 12.6-15.1×10^6 kcal/day =~1000 Chinook salmon/day
Ward looked at all available Chinook time series and found many correlations, including between runs, but the strongest correlations were not with the Fraser nor the Columbia.
Interesting population projection figure from Ward (2013)
Post-workshops we have been looking at trends in other marine mammals: AK and NR KWs increasing, CA sea lions now ~6x 1975 levels, harbor seals 6-8x…
Overview of salmon status
- Historic Chinook salmon abundance figure (compiled Jim Myers, NWFSC): Biggest reductions were in Columbia (~-3-5x) and Central Valley (~-3-4x)
- Bonneville time series (1938-2014) shows abundance declines happened a long time ago (pre-dams!). 2014 levels approaching 1888 average levels!
- A lot of the historical losses are due to extirpations (Gustafson et al., 2007): biggest extinct populations were in Columbia above Grand Coulee and Snake
- Run timing changes: Columbia example — ~10x reduction in interior run (above Bonneville) from ~2.5 million to ~200k.
- Hatchery production rose from 1950 to peak in mid-80s and in 2000 was near 1970s levels (Naish et al. 2007)
- Puget Sound historical abundance is ~700k (based on cannery pack in 1908); current wild escapement is ~50k; hatcheries add ~300k.
Recovery activities
- Habitat: 31,000 projects completed at 51,000 locations throughout Pac NW. Over $1 billion spent on restoration to date.
- Hatcheries: overall reductions in hatchery releases in last few decades, and limiting genetic impacts on wild fish. One example of reductions to near zero is on OR coast…
- Harvest: easiest to change and responsive; examples of successful catch reductions are Hood Canal summer chum. Coastwide harvest % has decreased by ~factor of 2 over last 30 years
- Hydro: improved fish passage, predator control, spill, barging; dam removal on Elwha, Condit, Rogue, Sandy, Hood River
- Heat: potential effects of climate change mostly not great for salmon; summarized by Stoute et al. 2010 and Wainwright and Weitkamp in prep
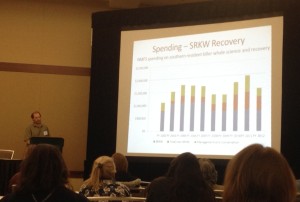
Budget comparison
- Orca recovery spending: FY12 1.2M on science/research; ~300k on management/conservation
- Orca salmon spending: FY12 600M!! Columbia only is 450M!
1:40 break
David Troutt, Director of Nisqually Natural Resources (for 35 years) and Chair of SRC (=Salmon Recovery Counci)
WA State salmon recovery — How we work together
2:02
State broken into regions, each with their own recovery plans (developed through the “WA way” involving many stakeholders, endorsed by Feds). Go to RCO web site for more information.
Study completed in March 2011 estimated costs of all planned regional plans is ~$5.5 billion. Funds dispersed through Salmon Recovery Funding Boards established in 1999. Funds come from PCSRF and others… Note: it is a LOT cheaper to protect than to restore…
10% of Federal grants must be used for monitoring. Example: About 80% of Nisqually outgoing smolts remain in estuary; 20% seek pocket estuaries elsewhere, but we see almost no returns of fish using the latter strategy.
There is a problem with marine survival in Puget Sound. We see 95% mortality of tagged out-going smolts between the Nisqually and Port Angeles. We’re confident that the estuary is in much better shape and 77% of the mainstem is in permanent stewardship, but we’re not seeing any result in the numbers of returning adults!
2:15 Tribal perspectives
Story: a generation of Nisqually fishers have never caught a steelhead. Annual catches of ~2k by tribes and ~2k by recreational fisheries collapsed (in 1990s?) to total run of ~500, a condition which persists. The treaties have not been withheld (and the tribes have not “shot at y’all in a long time”).
We need to work together towards ecosystem restoration. The tribes are interested in actions related to all H’s. The tribes have been working with the State to adapt how we run hatcheries to support harvest, but also be consistent with recovery goals. The North of Falcon process is part art, part science, but it is transparent and it works.
Rich Osborne, North Pacific Coast Lead Entity Coordinator (WRIA 20)
WA Sustainable Salmon Partnership — Salmon recovery on the WA coast
2:25
What’s unique about the outer coast in terms of salmon restoration?
- All 5 salmon species and steel head; none are listed except Ozette sockeye.
- Large areas are encompassed within tribal lands, which allows alternative restoration strategies.
- Almost no people! Only 7000 people on coast with no residential areas
- Large portions of watersheds in National Park, other large areas in National Forests.
Formed a non-profit to raise money beyond the SRFB: the WA Coast Sustainable Salmon Foundation. WRIA 21 = Quinalt; WRIA 22&23 Grays Harbor; WRIA 24 Pacific County.
Example projects:
- Goodman Creek road decommissioning (4 miles of road and fill removed)
- Quinalt: old logging road and fish passage blockage removal — facilitated by ability for tribe to control local decisions.
- Grays Harbor: huge estuary Chehalis has spectrum of impacts (industrial, logging, headwaters in National Park), but again not many people
- Pacific County (Willapa Bay): huge estuary w/few people; mostly Weyerhauser timber operations between pristine upper watersheds and the ocean.
28 Chinook stocks returning only 30-40,000, but could be 100s of 1000s…
An additional 12 million hatchery fish released from coastal watersheds per year
Salmon stronghold study areas (circa 2006)
 Jeannette Dormer, Puget Sound Partnership
Salmon Recovery in Puget Sound
2:45
In contrast, there are 4.1 million people in the Puget Sound region: 12 counties, 20 large cities, 100 cities total, 17 treaty tribes, many NGOs; 15 lead entities; Puget Sound Salmon Recovery Council (not the Partnership) is policy body to oversee implementation of the PS salmon recovery plan.
6 salmonid species, 3 listed under ESA (PS Chinook threatened in 1999, Hood Canal summer chum threatened in 1999, 2007 Puget Sound steelhead).
Salmon recovery success example: Puget Sound Acquisition & Restoration (PSAR) Fund. Regional priority list; increased from $15 million to $70 million appropriated for 2013-2015 biennium
- 100s of acres of estuary restoration in Snohomish and Skagit rivers
- Elwha dry lake bed reforesting
- 3+ acres eel grass on Bainbridge
- Seahurst seawall removal and restoration
Intersection with orca…
3:05
Jacque White, Exec. Director of Long Live the Kings (used to work at P4PS and Nature Conservancy)
Salish Sea marine survival project
Many partners supporting the coordinating organizations — Long Live the Kings in U.S. and Pacific Salmon Foundation in Canada
“Puget Sound salmon are sick and we don’t know why…”
- Coho marine survival declined sharply in 1980s from ~3% to <~0.5% and has persisted, while during the same period (1974-2007) WA/BC coastal survival has been fluctuating around a mean of ~0.5%. There are similar trends for steelhead and Chinook.
- Declines in Fraser sockeye, steelhead, herring spawning areas, forage fishes, hake, lingcod
- Rises in Harbor seals, lags, temperatures, and human population
- Little effort to integrate research efforts
- Now seeing economic impacts on humans (sports fishing, tribes, First Nations)
Time line:
- 2007 State of the Salmon in 2007 focused on interactions of wild and hatchery salmon
- 2012 fall workshop led to idea of a transboundary project to increase survival in the Salish Sea, improve accuracy of adult return forecasting, and assess success (or failure) of existing salmon recovery efforts.
- 2014 Comprehensive planning
- 2015+ Implementation of research
Hypotheses (trying to identify factors that control salmon and steelhead survival that can be managed)
- Bottom-up processes (PDO, environment, forage fish changes to which salmonids haven’t been able to compensate)
- Top-down (predation…)
- Other factors (toxics, disease…)
Research activities
- Focus on juvenile fish
- Predation of seals on steelhead
3:45 break
Panel discussion (audio recording: .ogg [~68 Mb] | .mp3 [~34 Mb]; responses are hard to hear for some panelists who did not use microphones)
3:58 Begin
5:14 Final comments and next steps (also included in audio recordings)
Read More


 Twitter
 LinkedIn
 Facebook